EVA Co-participation networks at MDRS
Interactive network visualisation of crew interaction in Mars simulations at the MDRS
I come from an interdisciplinary background (journalism-nationalism studies-sociology). As a journalist, I tell stories; and as a researcher, I want to do the same. A well done web application or a well done web page is a more efficient way to communicate one’s scholarship than an academic article. Yes, in academia it is still seen as a supplement rather than a substitute to a peer reviewed publication. And it’s a pity – it takes a lot of time, skills, and effort to create even the simplest visuals. On the other hand, it still is time well spent: by creating a visual story, one gets to know their data very intimately. And the world does not end with academia – it is helpful to leave the ivory tower and engage with the audiences outside of it.
Gender inequality and space
Structural inequality and cultural beliefs, that shape societies at large, are imported into small group settings every time we interact. In work groups we subconsciously stereotype others, and judge about their abilities based on their gender, race, ethnicity and other observable characteristics. This happens both in newly formed, and in long term task groups – in latter, stereotypes keep influencing our decisions even if we are aware how well or poorly our teammates have performed in the past.
Those who are deemed more qualified for the task at hand, have more influence, or in other words, have a higher in-group status. It is a self-fulfilling prophesy: we know who should be better at a task based on our stereotypical knowledge, and then we let them lead our group and contribute more to the task. But even if we know their actual abilities, stereotypical knowledge will continue to influence the formation of the status hierarchy in the group.
How does gender shape status hierarchy in small isolated groups? I used freely available data from the Mars Desert Research Station (MDRS) to explore how gender influences informal status hierarchy in crews that participate in space analog simulations.
About MDRS crews
MDRS is a space analog facility in Utah owned and operated by a non-profit Mars Society. Each year, MDRS hosts an eight month field season for professional scientists and engineers as well as college students of all levels, in training for human operations specifically on Mars. Most missions are 2 weeks in duration. To this day, >200 crews have conducted their research on the site over the course of 19 field seasons.
Most of the crews consist of six members, each of them are assigned the following roles: Commander, Executive Officer, Health and Safety Officer, Crew Biologist or Astrophysicist, Crew Geologist or Chief Engineer. These roles are consistent to most part across different crews. Each crew member has to file daily logs and reports; most reports from previous crews have been archived and available online through the MDRS website. In addition to logs, members of each crew post a short biography of themselves, usually including their education, occupation and other information relevant to their participation in a simulation.
Extravehicular activities (EVAs), or simulated spacewalks, are a crucial part of Mars habitat simulation. Crew members are asked to form EVA teams based on skills needed for a specific EVA. If we know who participates in EVAs more often, we can have a glimpse to the crew status hierarchy.
Data
I selected daily logs and biographic entries from 30 random crews. I read through daily logs to get names of participats in each EVA. I got their sociodemographic information from their posted bios. I constructed co-participation matrices and calculated centrality scores for each individual (e.g. who participated in more EVAs with more people).
Interactive app to explore data
I used R packages shiny, visnetwork, and plotly to create interactive web application for data exploration.
The main drop down menu selects a crew to display. A network graph shows who worked with whom on extravehicular activities (EVAs). Each node is a crew member, and the size of a tie represents how many times these people worked together on an EVA. A bar chart in the bottom right corner shows the total number of EVAs that a crew member participated in.
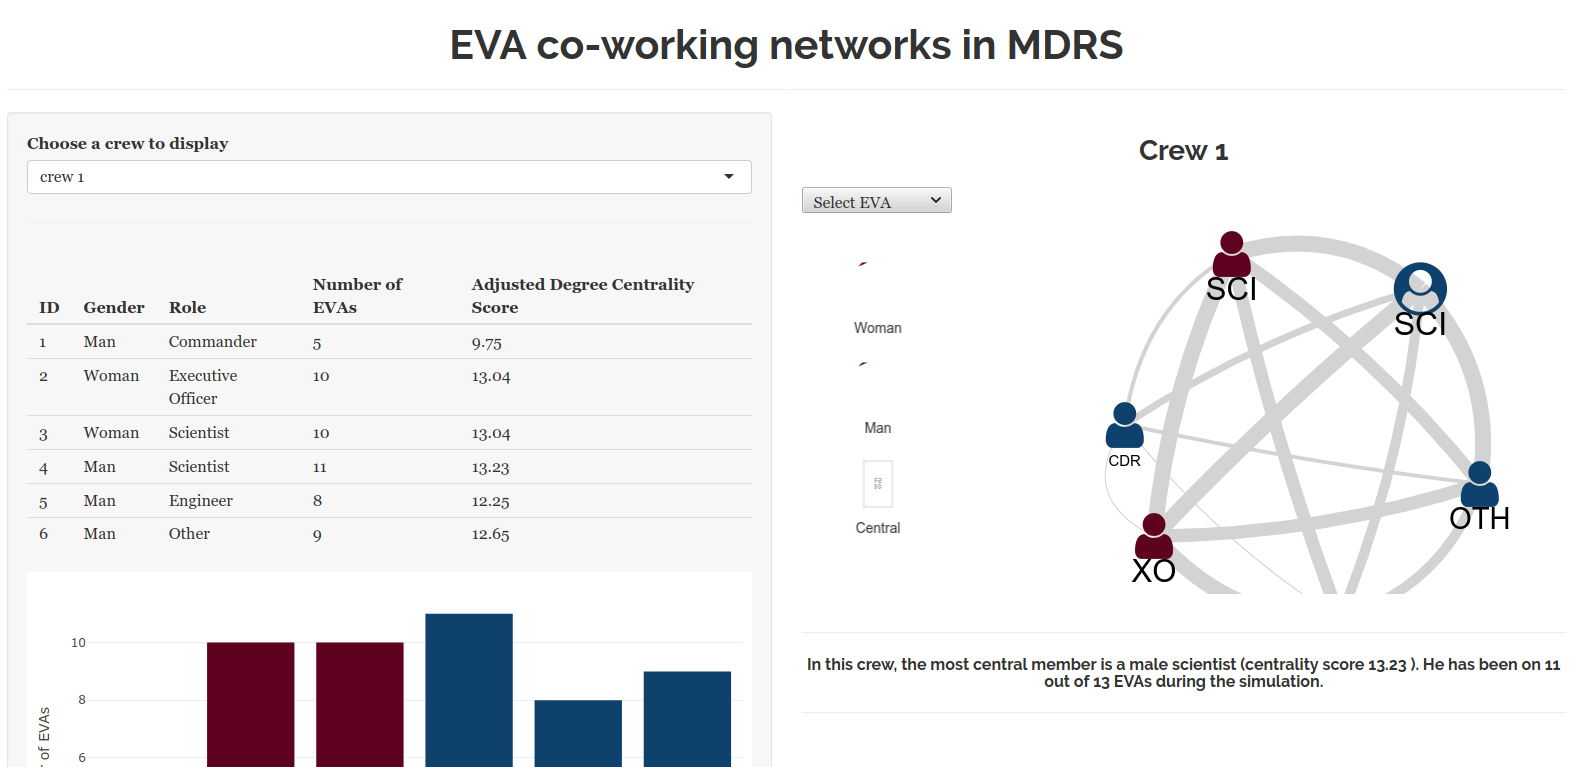
I selected to visualize two characteristics – crew members’ gender and their official crew role.
A user can also select a single EVA to see which crew members worked together. They can also see which crew member was the most central in the EVAs conducted by that crew.
Now, go and explore my data yourself .